The Glenbuchat Image Library
No: 1211 Contributor: No Contributor Year: 2015
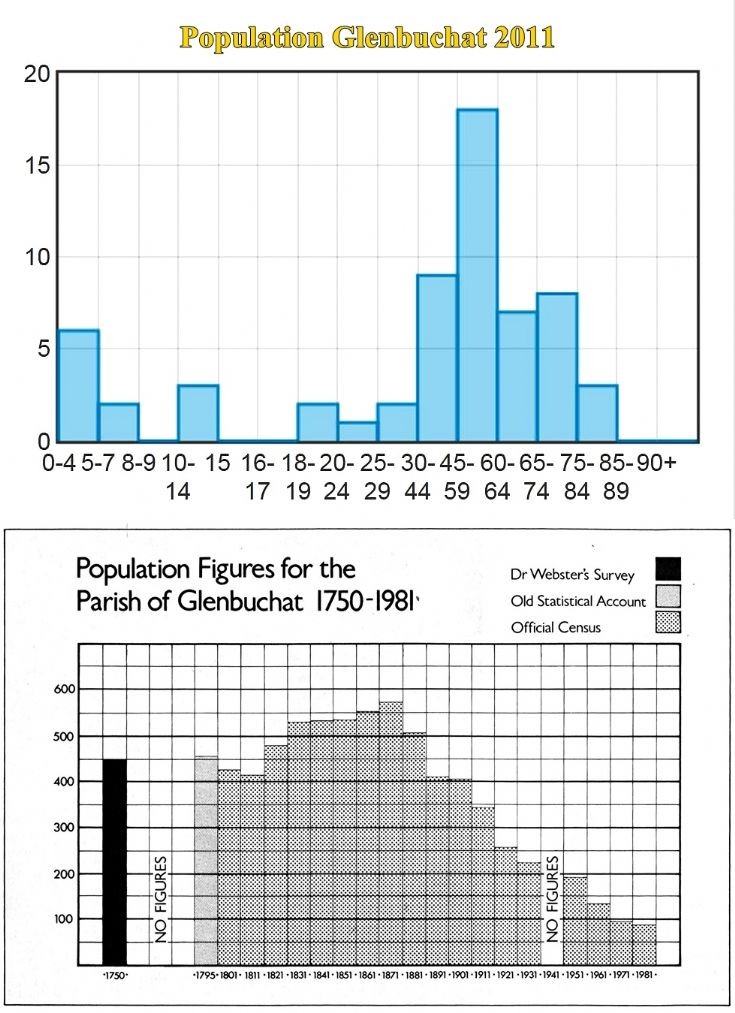
126 2011 Census Glenbuchat


2011 Census Glenbuchat
The understanding of the Heritage of Glenbuchat has been greatly assisted by periodical production of Census’s and Statistical accounts.
Click below to see the previous ones on this site.
1696 Poll Book of Glenbucket
1791 Statistical Account Glenbucket
1791 Statistical Account Strathdon
1834 Statistical Account Glenbucket
1841 Census Glenbucket
1845 Statistical Account Strathdon
1851 Census Glenbucket
1956 Statistical Account Glenbucket
The latest Census for 2011 results are available on line at Streetcheck
Census 2011 for Glenbuchat
Introduction
This postcode in Glenbuchat is in Scotland. The postcode is within the Aboyne, Upper Deeside and Donside ward/electoral division, which is in the constituency of West Aberdeenshire and Kincardine. This page combines information for the address Glenbuchat, Strathdon, Scotland, AB36 8UA, and the neighbourhood in which it resides. If you wish, you can also view information for the whole of AB36 here.
Basic Information
Area Type Very Remote Rural
Ward Aboyne, Upper Deeside and Donside
Constituency West Aberdeenshire and Kincardine
Region Scotland Constituencies
Country Scotland
Social Grade
Social Grade approximations are derived from an algorithm created by the Market Research Society. The figures shown are per-household rather than individual - more specifically, the job title and employer of the "household reference person" is used, analogous to what traditionally was called the head of the household. Only household reference persons between the ages of 16-64 are included.
Gender
Across the UK as a whole, the gender split is roughly equal at 49% male, 51% female. This address in West Aberdeenshire and Kincardine is broadly in line with those figures, with 52% male
| Gender | ||
|---|---|---|
| Male | 32 | |
| Female | 29 | |
| Total | 61 |
Age Groups
Across the UK as a whole, the median age is 39. In general, inner city areas show high concentrations of people aged 18-30, suburbs show larger numbers of small children and adults aged 30-50, and rural and small towns are more popular with older workers and retirees. Many poorer areas lack a majority age group, which is due in part to the people in that area being constrained by circumstance rather than being able to choose where to retire, raise a family or grow up.
| Age Groups | ||
|---|---|---|
| 0-4 | 6 | |
| 05-Jul | 2 | |
| 08-Sep | 0 | |
| Oct-14 | 2 | |
| 15 | 0 | |
| 16-17 | 0 | |
| 18-19 | 2 | |
| 20-24 | 1 | |
| 25-29 | 2 | |
| 30-44 | 9 | |
| 45-59 | 18 | |
| 60-64 | 7 | |
| 65-74 | 8 | |
| 75-84 | 3 | |
| 85-89 | 0 | |
| 90+ | 0 | |
| Total | 61 |
Relationship Status
The postcode AB36 8UA does not show a significant deviation from the average figures for the UK. In the UK as a whole, the average figures are approximately as follows for relationship statuses: 34% single, 47% married, 3% separated, 9% divorced, 7% widowed, and 0.2% same sex.
Figures for relationship status do not include those aged under 16, or those family members aged 16-18 who are in full-time education.
| Relationship Status | ||
|---|---|---|
| Single | 12 | |
| Married | 22 | |
| Divorced | 13 | |
| Separated | 0 | |
| Widowed | 3 | |
| Same Sex | 0 | |
| Total | 50 |
Health in the UK is strongly tied to age as you would expect, but the affluence of a neighbourhood also has strong influence, with deprived areas often showing poorer standards of health.
Overall, the UK considers itself to be healthy - 81.1% of residents rated their health as Very Good or Good. The full breakdown is as follows for the United Kingdom: 47.1% Very Good, 34% Good, 13.3% Fair, 4.3% Bad and 1.3% Very Bad.
| Health | |||
|---|---|---|---|
| Very Good | 26 | ||
| Good | 28 | ||
| Fair | 6 | ||
| Bad | 1 | ||
| Very Bad | 0 | ||
| Total | 61 |
Education & Qualifications
At the time of the 2011 census, across the UK 22.9% of residents had no qualification, 13.2% had 1-4 GCSEs, 15.2% had 5+ GCSEs and 1-2 A/AS-Levels, 12.3% had 2+ A-Levels, 27.1% had a degree (or similar), and 3.6% had an apprenticeship.
| Highest Qualification Level Achieved | ||||||||||||
|---|---|---|---|---|---|---|---|---|---|---|---|---|
| Degree or Similar e.g. professional qualification (accountancy etc) | 20 | |||||||||||
| Apprenticeship | 0 | |||||||||||
| 2+ A Levels | 6 | |||||||||||
| 5+ GCSEs, an A-Level or 1-2 AS Levels | 8 | |||||||||||
| 1-4 GCSEs | 9 | |||||||||||
| No GCSEs | 7 | |||||||||||
| Total | 50 | |||||||||||
| Social Grade | ||||||||||||
| AB - Higher and intermediate managerial, administrative, or professional positions | 8 | |||||||||||
| C1 - Supervisory, clerical, and junior managerial/administrative/professional positions | 4 | |||||||||||
| C2 - Skilled manual workers | 7 | |||||||||||
| DE - Semi-skilled and unskilled manual workers; those on state benefit/unemployed, & lowest grade workers | 6 | |||||||||||
| Total | 25 |
Housing Types
The area containing Glenbuchat, Strathdon, Scotland consists predominantly of detached housing, a strong indicator of affluence. Please note that the figures may include adjacent streets - see the Summary tab for an explanation and map of the area that these figures cover.
| Housing Types | |||
|---|---|---|---|
| Detached | 56 | ||
| Semi-Detached | 2 | ||
| Terraced | 0 | ||
| Flat (Purpose-Built) | 0 | ||
| Flat (Converted) | 0 | ||
| Caravan/Park/Temporary | 1 | ||
| Total | 59 |
Housing Tenure
The area containing Glenbuchat, Strathdon, Scotland contains a higher than average level of rented housing (excluding social housing) - 25% of household spaces. This contrasts with the national average of just over 16%
| Housing Tenure | ||||||
|---|---|---|---|---|---|---|
| Owned Outright | 13 | |||||
| Owned with Mortgage | 6 | |||||
| Shared Ownership | 0 | |||||
| Rented: From Council | 0 | |||||
| Rented: Other Social | 0 | |||||
| Rented: Private Landlord inc. letting agents | 7 | |||||
| Rented: Other | 1 | |||||
| Rent Free | 5 | |||||
| Total | 32 |
Housing Occupancy
This data lists the total number of residents normally resident within each household. The figures do not record under- or over-occupancy.
| Housing Occupancy | |||
|---|---|---|---|
| One Person | 14 | ||
| Two People | 12 | ||
| Three People | 2 | ||
| Four People | 3 | ||
| Five People | 1 | ||
| Six People | 0 | ||
| Seven People | 0 | ||
| 8+ People | 0 | ||
| Total | 32 |
Ethnic Group
Glenbuchat, Strathdon, Scotland can be considered less ethnically diverse than the UK average. As whole, the UK population claims itself as approximately 86% white, with residents of this area being exclusively so.
The UK is home to a number of sizable populations of non-white residents, with mixed ethnicity (2.1%), Indian (2.4%) and Pakistani (1.9%) being the largest groups reported.
There is considerable division of ethnicities within the UK, with ethnically diverse addresses uncommon outside of urban areas.
| Ethnic Group | |||
|---|---|---|---|
| White | 61 | ||
| Total | 61 |
Country of Birth
At the time of the 2011 census, approximately 83.3% of the resident population of Scotland was born in Scotland. The other groups were 8.7% English, 0.3% Welsh, 0.7% Northern Irish, 0.4% from the Republic of Ireland, 2.6% from other European Union countries, and 4% from outside of Europe.
| Country of Birth | ||||
|---|---|---|---|---|
| England | 22 | |||
| Wales | 1 | |||
| Scotland | 35 | |||
| Northern Ireland | 0 | |||
| Republic of Ireland | 0 | |||
| European Union | 0 | |||
| Other | 3 | |||
| Total | 61 |
Religion
Scotland is primarily a Christian country, with 15.9% of residents Catholic, 37.9% other Christians, and 2.5% other religions. Approximately 36.7% of residents state that they have no religion or are Atheist, while 7% did not state their religious views.
| Religion | ||
|---|---|---|
| Catholic | 2 | |
| Other Christian | 23 | |
| No Religion | 31 | |
| Buddhist | 0 | |
| Hindu | 0 | |
| Jewish | 0 | |
| Muslim | 0 | |
| Sikh | 0 | |
| Other Religion | 0 | |
| Not Stated | 5 | |
| Total | 61 |
Economic Activity
This address within Aboyne, Upper Deeside and Donside is entrepreneurial, with a larger than average concentration of residents that are self-employed - 21% of the resident population. On average, around 9.7% of census respondents were self-employed. Male residents were more than twice as likely to be self-employed than women.
Figures for economic activity do not include those aged under 16, or those family members aged 16-18 who are in full-time education. This data is therefore based on 42.4 million of the United Kingdom's 57.8 million residents. The data was correct as of the 2011 census, which was a period of depressed economic activity
| Economic Activity | |||||
|---|---|---|---|---|---|
| Full-Time Employee | 14 | ||||
| Part-Time Employee(defined as 30 hours or less per week) | 6 | ||||
| Self Employed | 10 | ||||
| Unemployed | 2 | ||||
| Full-Time Student(with or without job) | 1 | ||||
| Retired | 8 | ||||
| Looking After Home or Family | 2 | ||||
| Long-Term Sick or Disabled | 1 | ||||
| Other | 3 | ||||
| Total | 47 |
Employment/Industry
This data is based on resident aged 16-74 on census day 2011, who were in employment.
| Employment Industry | |||||
|---|---|---|---|---|---|
| Agriculture Inc. Forestry and Fishing | 2 | ||||
| Manufacturing | 1 | ||||
| Construction | 1 | ||||
| Retail Inc. Wholesale | 3 | ||||
| Information and Communication | 1 | ||||
| Real Estate | 2 | ||||
| Professional, Scientific and Technical | 4 | ||||
| Administration | 3 | ||||
| Public Administration and Defence | 3 | ||||
| Education | 3 | ||||
| Health Inc. Social Work | 3 | ||||
| Other Inc. Arts, Recreation etc. | 4 | ||||
| Total | 30 |
Picture added on 13 December 2015 at 21:08
03. History from The Web